Methods for cellular behavior analysis in live-cell imaging
Our preprint on cellular behavior analysis in TCR T cells & cancer cell live-cell imaging co-cultures is out! This three-year collaboration led by postdoc Archit Verma is in collaboration with Alex Marson & Julia Carnevale, with cellular segmentation & tracking by David Van Valen & his amazing team! [bioRxiv].
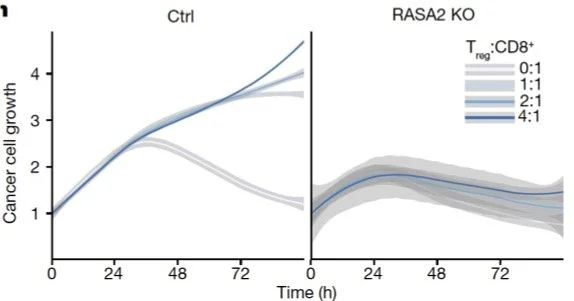
Incucyte live cell imaging is ubiquitous, but from this complex data cancer immunologists typically plot one thing: the number of red pixels in the well, which is a proxy for the cancer cell coverage (RFP marks cancer cell nuclei). From [Carnevale et al. 2022]:
A lot of interesting signal is left on the cutting room floor. For example, proliferation (rates) in cancer cells, cancer cell death, which is quite rare in much of these data, and amazing pack hunting behaviors of the modified T cells (I’m struggling with the videos — I’ll get help and get back to you!).
We teamed up with Alex Marson and Julia Carnevale’s Labs, who imaged TCR T cells co-cultured with RFP+ A375 tumor cells under three conditions: Safe harbor knockout (SH KO; control), RASA2 KO [Carnevale et al., 2022], CUL5 KO [Liao et al., 2024]. Each well was imaged every four minutes at 10X magnification on Sartorius Incucyte for 72 hrs. Images include brightfield, RFP (marking cancer cell nuclei) channels.
Then, the Van Valen Lab developed Caliban to segment and track each cell (green are T cells, red are cancer cells):
With the masked, tracked cells, we went to work to develop Occident. We were curious how well the RFP markers captured cancer cell number; we found that RFP lags as a proxy for cancer cell numbers.
We found that T cell proliferation increased in the two beneficial KO T cells, in the CUL5 KO T cells in particular.
We can study differences in cancer cell division events (lower in beneficial KO T cells) and average T cell speed (faster in beneficial KO T cells).
We found that the number of T cells attached to cancer cells reduces the likelihood that the cancer cell will proliferate, with the beneficial KO T cells having greater effects on proliferation reduction.
Cancer cell and T cell morphology changes dramatically depending on state. These changes are visible in the brightfield imaging – active interacting T cells are larger and change to less circular shapes. Cancer cell begin to aggregate together when interacting with T cells.
While the number of T cell--cancer cell interactions increased similarly across time, these interactions & their effects were modulated by the CRISPR KOs. For example, the amount of time a T cell remained attached to a cancer cell (as estimated by a negative binomial and Markov model separately) was highest in RASA2 KO T cells.
Even more exciting, the speed of cancer cells decreased after interactions with T cells, as did their overall size (indicating stress).
Most thrilling is that we can identify active T cells based on relative cell size and morphology, and watch T cells activate (differentially based on condition) after interacting with cancer cells.
With a Markov model, we deconvolved the situation when, in frame at time t-1, there is one cancer cell and one T cell in a small window, and in frame at time t there is one cancer cell and two T cells. We were able to quantify how often this doubling of T cells attacking a cancer cell was due to proliferation or due to recruitment.
In summary, we found that, compared to the SH KO control condition, TCR T cells with the RASA2 KO have a longer dwell time and cripple cancer cells more effectively this way, whereas TCR T cells with the CUL5 KO proliferated more frequently upon activation, adding more T cells to the fight.
With five new collaborations in the works, and a paper characterizing the differences in condition using explainable AI already accepted as an oral presentation at #PSB2025 (lead by high school senior Marcus Blennemann), look for future work in this space, and try out Caliban and Occident on your own Incucyte data! More phenotypes and analyses added regularly.
Feedback welcome! And please play with these data! There is a lot more signal there.
Thank you to Bioimage Archive for hosting these Incucyte image data -- this is a new thing for them, and they have been so kind in working through the details of submission (link coming soon!)! 🎉
Poisson reduced rank regression (PRRR)
Poisson Reduced Rank Regression for single-cell sequencing associations
Tiana Fitzgerald, Andy Jones, Barbara Engelhardt
Our paper developing count-based model for association mapping published in #BMCBioinformatics! Great work by amazing Princeton undergrad Tiana Fitzgerald and PhD student Andy Jones.
A Poisson reduced-rank regression model for association mapping in sequencing data
We develop a Poisson reduced-rank regression model to identify low-dimensional associations in high-dimensional data.
We adapted association mapping methods developed for bulk sequencing to count-based single-cell technologies. The goal here is to identify associations between cell-specific covariates and each cell's expression levels.
Our model, Poisson reduced rank regression (PRRR), is a Poisson regression model with a low-rank coefficient matrix.
We find that PRRR is useful in several applications. For example, finding transcriptional hallmarks of cell types (here, in scRNA-seq data from human pancreas).
In characterizing pancreatic cell types, we find that PRRR's learned latent factors correspond to well-established biological processes in pancreas islet and non-islet cells.
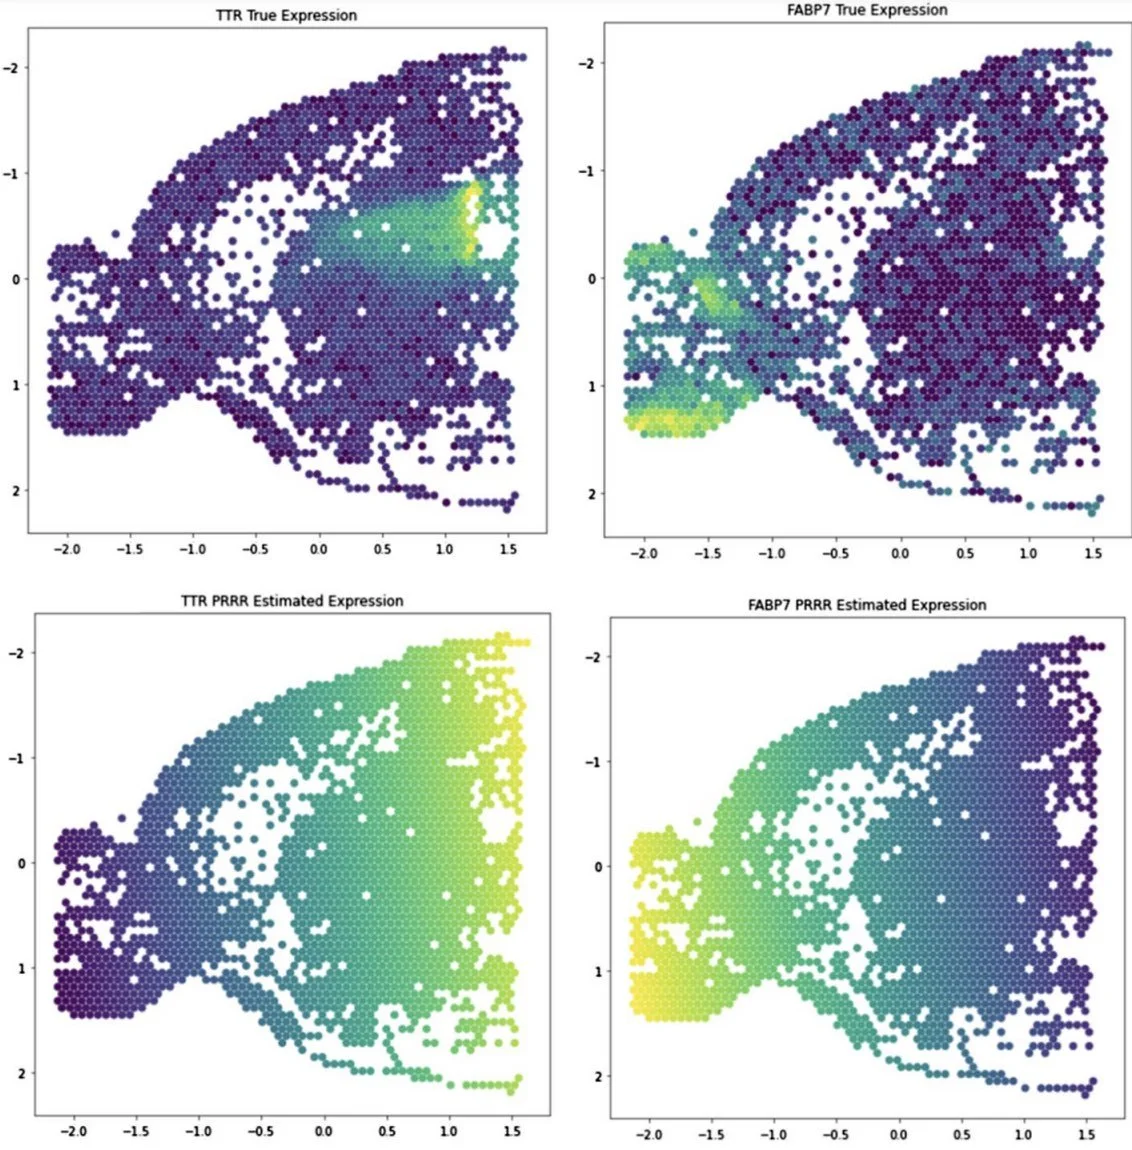
We also applied PRRR to spatial transcriptomics data, where we find that the model can identify associations between spatial coordinates and gene expression.
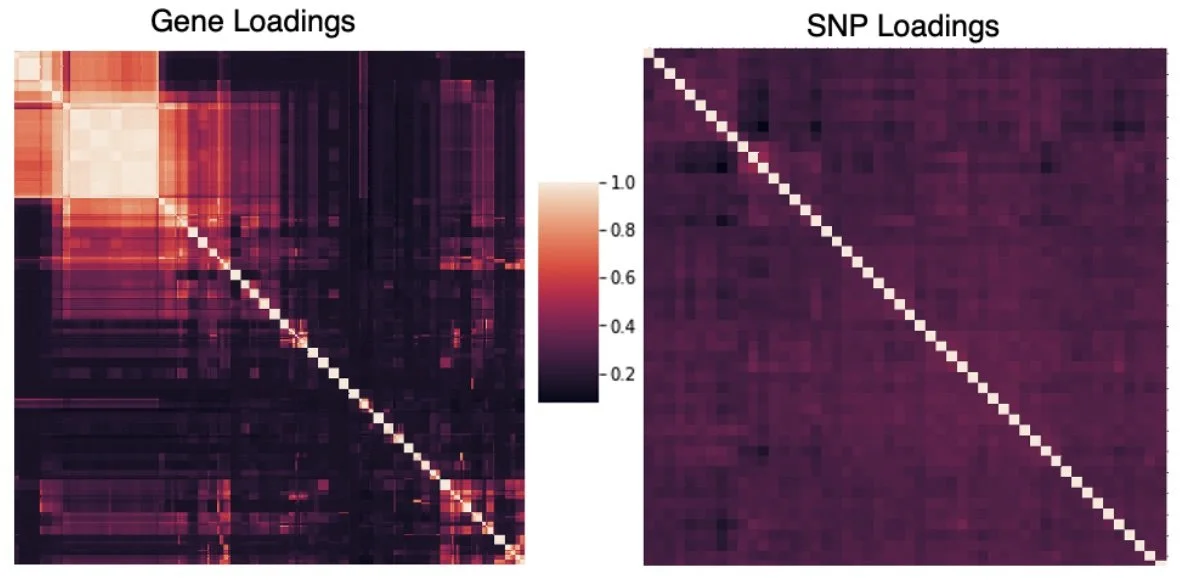
As a final application, we used PRRR to perform low-rank eQTL mapping in bulk RNA-seq data from GTEx. Applied to liver tissue samples, we find that the model's latent factors pick up correlated eQTLs corresponding to interferon gamma and inflammatory responses.
Code for the model and experiments in the paper is here. Try it out and let us know what you think!
single cell TBLDA
single cell telescoping bimodal latent Dirichlet allocation
BEEHIVE alumna Dr. Ari Gewirtz and @will_townes post preprint Expression QTLs in single-cell data that describes single-cell telescoping bimodal latent Dirichlet allocation (scTBLDA) applied to population-scale single-cell RNA-seq data to find expression QTLs.
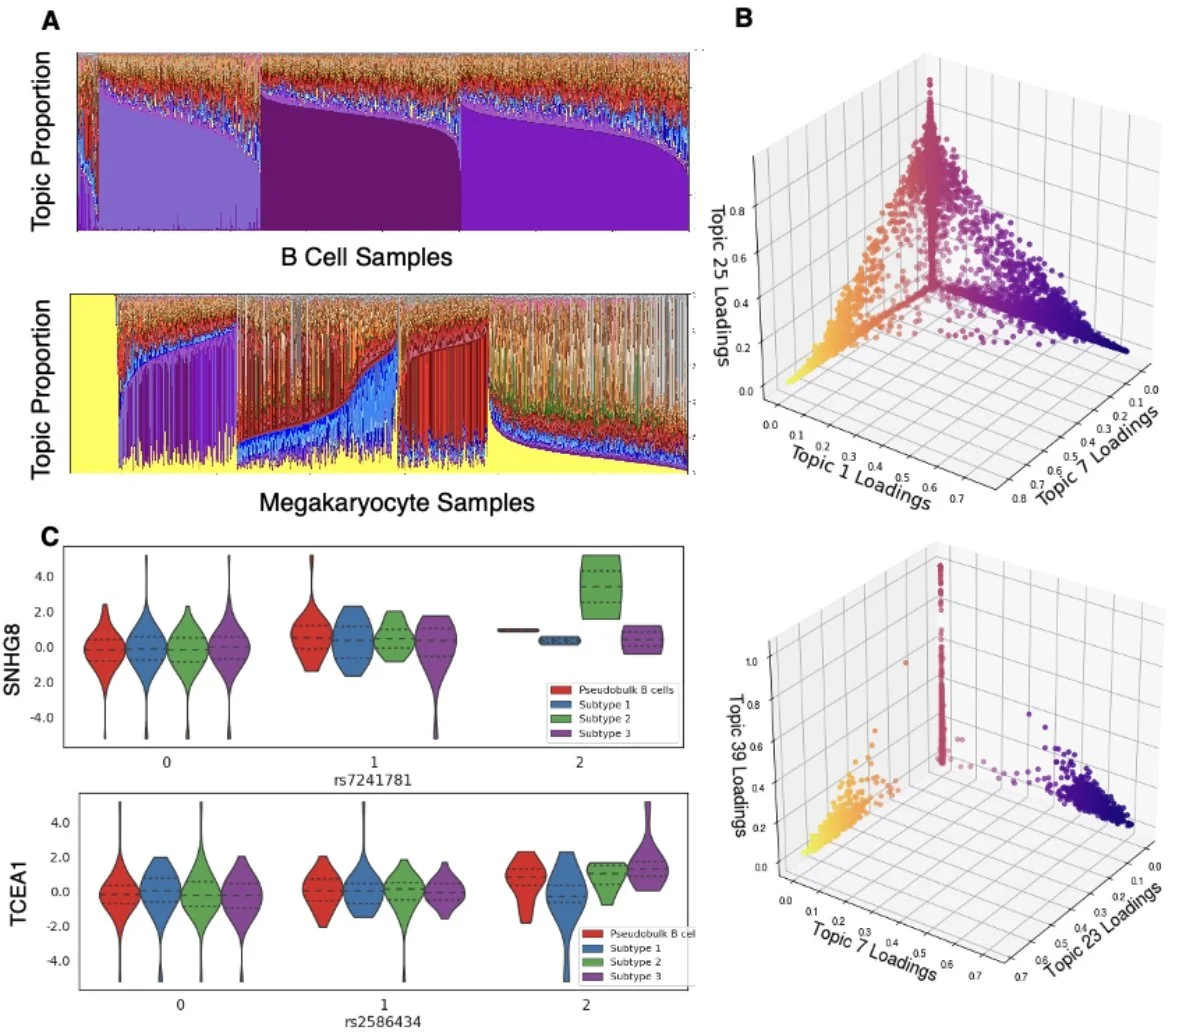
These beautiful scRNA-seq and paired genotype data come from Jimmie Yee's Lab and include approximately 400,000 peripheral blood mononuclear cells (PBMCs) from 119 women with systemic lupus erythematosus (SLE).
We extend our method, telescoping bimodal latent Dirichlet allocation (TBLDA), that identifies covarying genotypes and gene expression values when the matching from samples to cells is not one-to-one in order to allow cell-type label agnostic discovery of eQTLs in noncomposite scRNA-seq data. In particular, we add GPU-compatibility, sparse priors, and amortization to enable fast inference on large-scale scRNA-seq data.
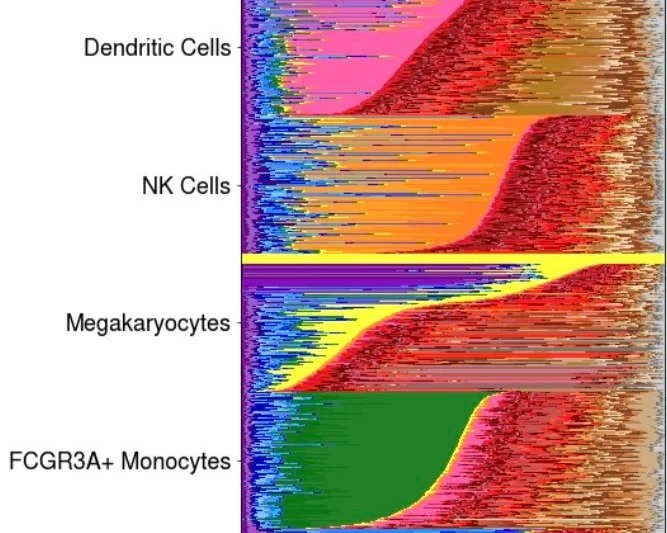
We find complex cell-type heterogeneity within specific immune cell-type labels.
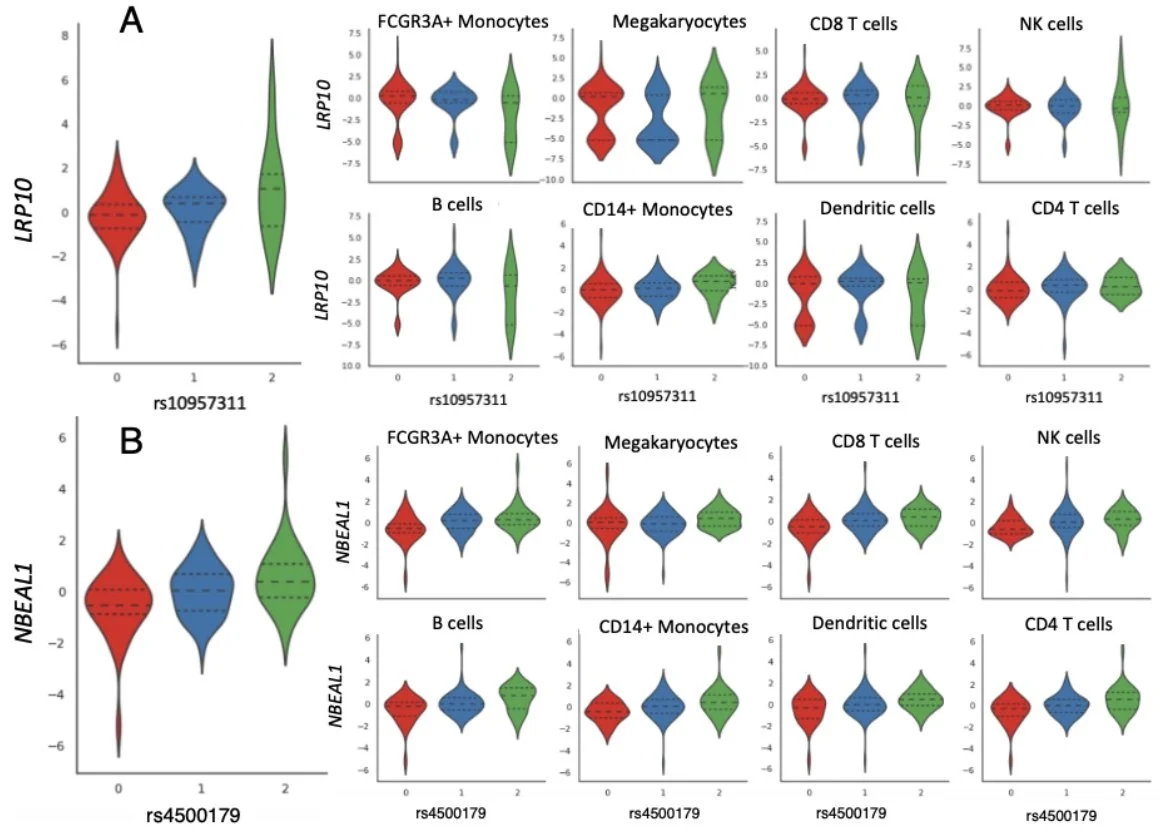
We use linked genes and SNPs to identify 205 cis-eQTLS, 66 trans-eQTLs, and 53 cell type proportion QTLs. Our results demonstrate the ability of scTBLDA to identify genes involved in cell-type specific regulatory processes associated with SNPs in single-cell data.
We found broad replication of our findings in three scRNA-seq studies: [van der Wijst et al. 2018], [Vosa et al. 2021], and [Fairfax et al. 2012].
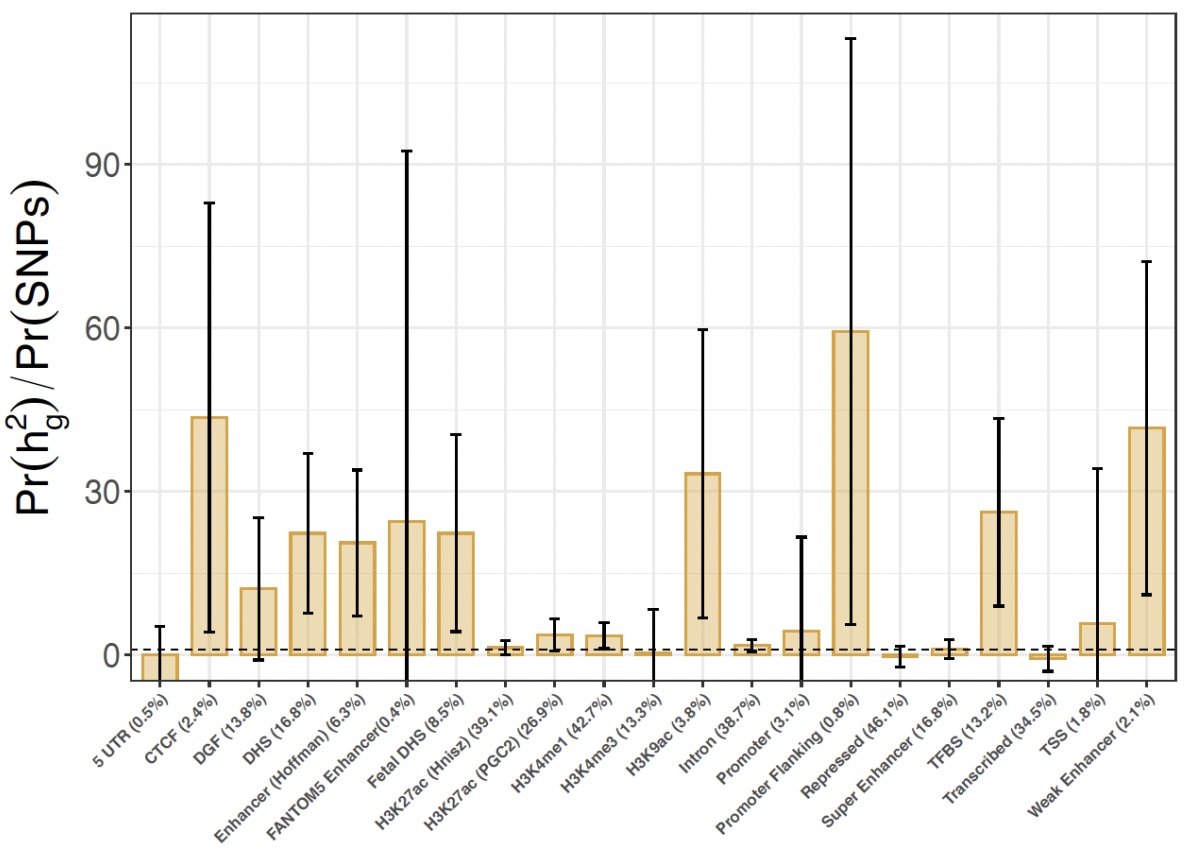
We found enrichment of our trans-eQTLs in enhancers using stratified LD score regression.
scTBLDA is an important step forward in methods for eQTL analysis in single-cell sequencing studies. Our approach shifts the paradigm of mapping QTLs from univariate analyses to an analysis that more accurately captures statistical complexities and biological models of regulation.
Code available for scTBLDA -- try it on your population-wide single-cell sequencing data! Feedback welcome!
Spatial experimental design
Spatial experimental design
New preprint on optimizing the design of spatial genomics studies! This represents the hard work of Andy Jones, Diana Cai, and Didong Li. When gathering spatial sequencing data from a tissue, typically parallel axis-aligned slices are selected, but these slices may contain redundant information. Can we make spatial genomics experiments more cost-efficient by profiling tissue slices that are maximally informative?
We propose a Bayesian optimal experimental design method for two separate spatial genomics contexts: building atlases of tissues/organs and identifying the boundaries of regions of interest---such as tumors---in tissue samples.
For a given genomic assay, our method iteratively selects the tissue slice that maximizes the expected information gain, i.e., the slice that is most likely to provide the greatest amount of new information on top of the data already collected.
To demonstrate our approach in the atlas-building context, we used the Allen Brain Atlas’s spatial gene expression data from mouse brain. We found that our sequential approach selects slices with more information in fewer slices compared to traditional serial slicing strategies.
We also applied our model to an experimental setting in which a tumor is being localized. Applied to Visium data from a prostate cancer sample, we find that our approach is able to achieve near-optimal bounding with four slices, as opposed to serial approaches, which take eight.
Feedback welcome! Try out our approach – we hope it will design an efficient and informative experiment for you!
